2015 Was The Safest Year Ever For U.S. Mining Industry
Updated on April 8, 2016 by Sales Team

The Mining Industry In The U.S. Just Concluded Its Safest Year Ever
Preliminary statistics released by MSHA the afternoon of Thursday, April 7 show that 2015 was the safest year ever in the U.S. mining industry. This closely mirrors the fatality analysis I conducted earlier this year. Mining deaths are down across the board and have been trending that way for decades.
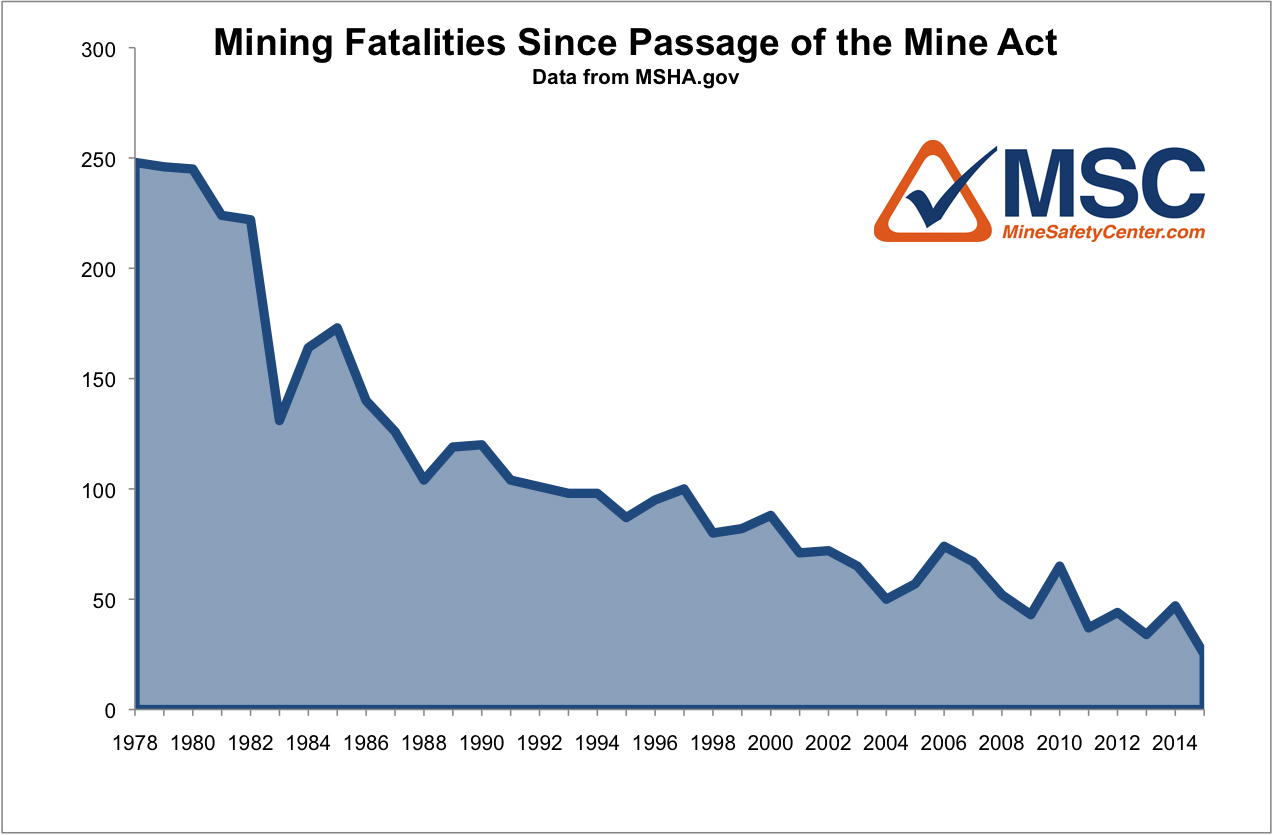
“In 2015, 28 miners died in mining accidents, down from 45 in 2014,” says Amy Louviere, MSHA’s media contact, in the press release.
But the announcement also released more granular data for 2015 than was previously available. This data allows an in depth analysis of the injury rate and total number of injuries. Ms. Louviere continued:
These rates are calculated based on hours of miners’ exposure, a relative measure taking into account recent employment changes in the mining market. The fatal injury rate, expressed as reported injuries per 200,000 hours worked, was the lowest in mining history for all mining at 0.0096.
Take a look at the progress on this key statistic over the last few years:
![]()
Mining Industry Injuries Down
But even more impressively, the mining injury incidence rate (again per 200,000 man-hours) dropped significantly. According to Ms. Louviere, “the all-injury rate – reported by mine operators – also dropped to a new low in 2015 at 2.28.”
Not only are less injuries leading to fatalities, there were also less injuries. Period.
Injuries and fatalities lowest ever in mining industry. Even when adjusted for man-hours worked.

Look at the trend over the last few years. This is outstanding progress:
![]()
The injury incidence rate is down 25% since 2009.
What does the injury rate translate to in actual numbers? After consulting this very cool incidence rate calculator (and brushing up on a little Algebra) I was able to figure out the total number of hours worked and injuries.
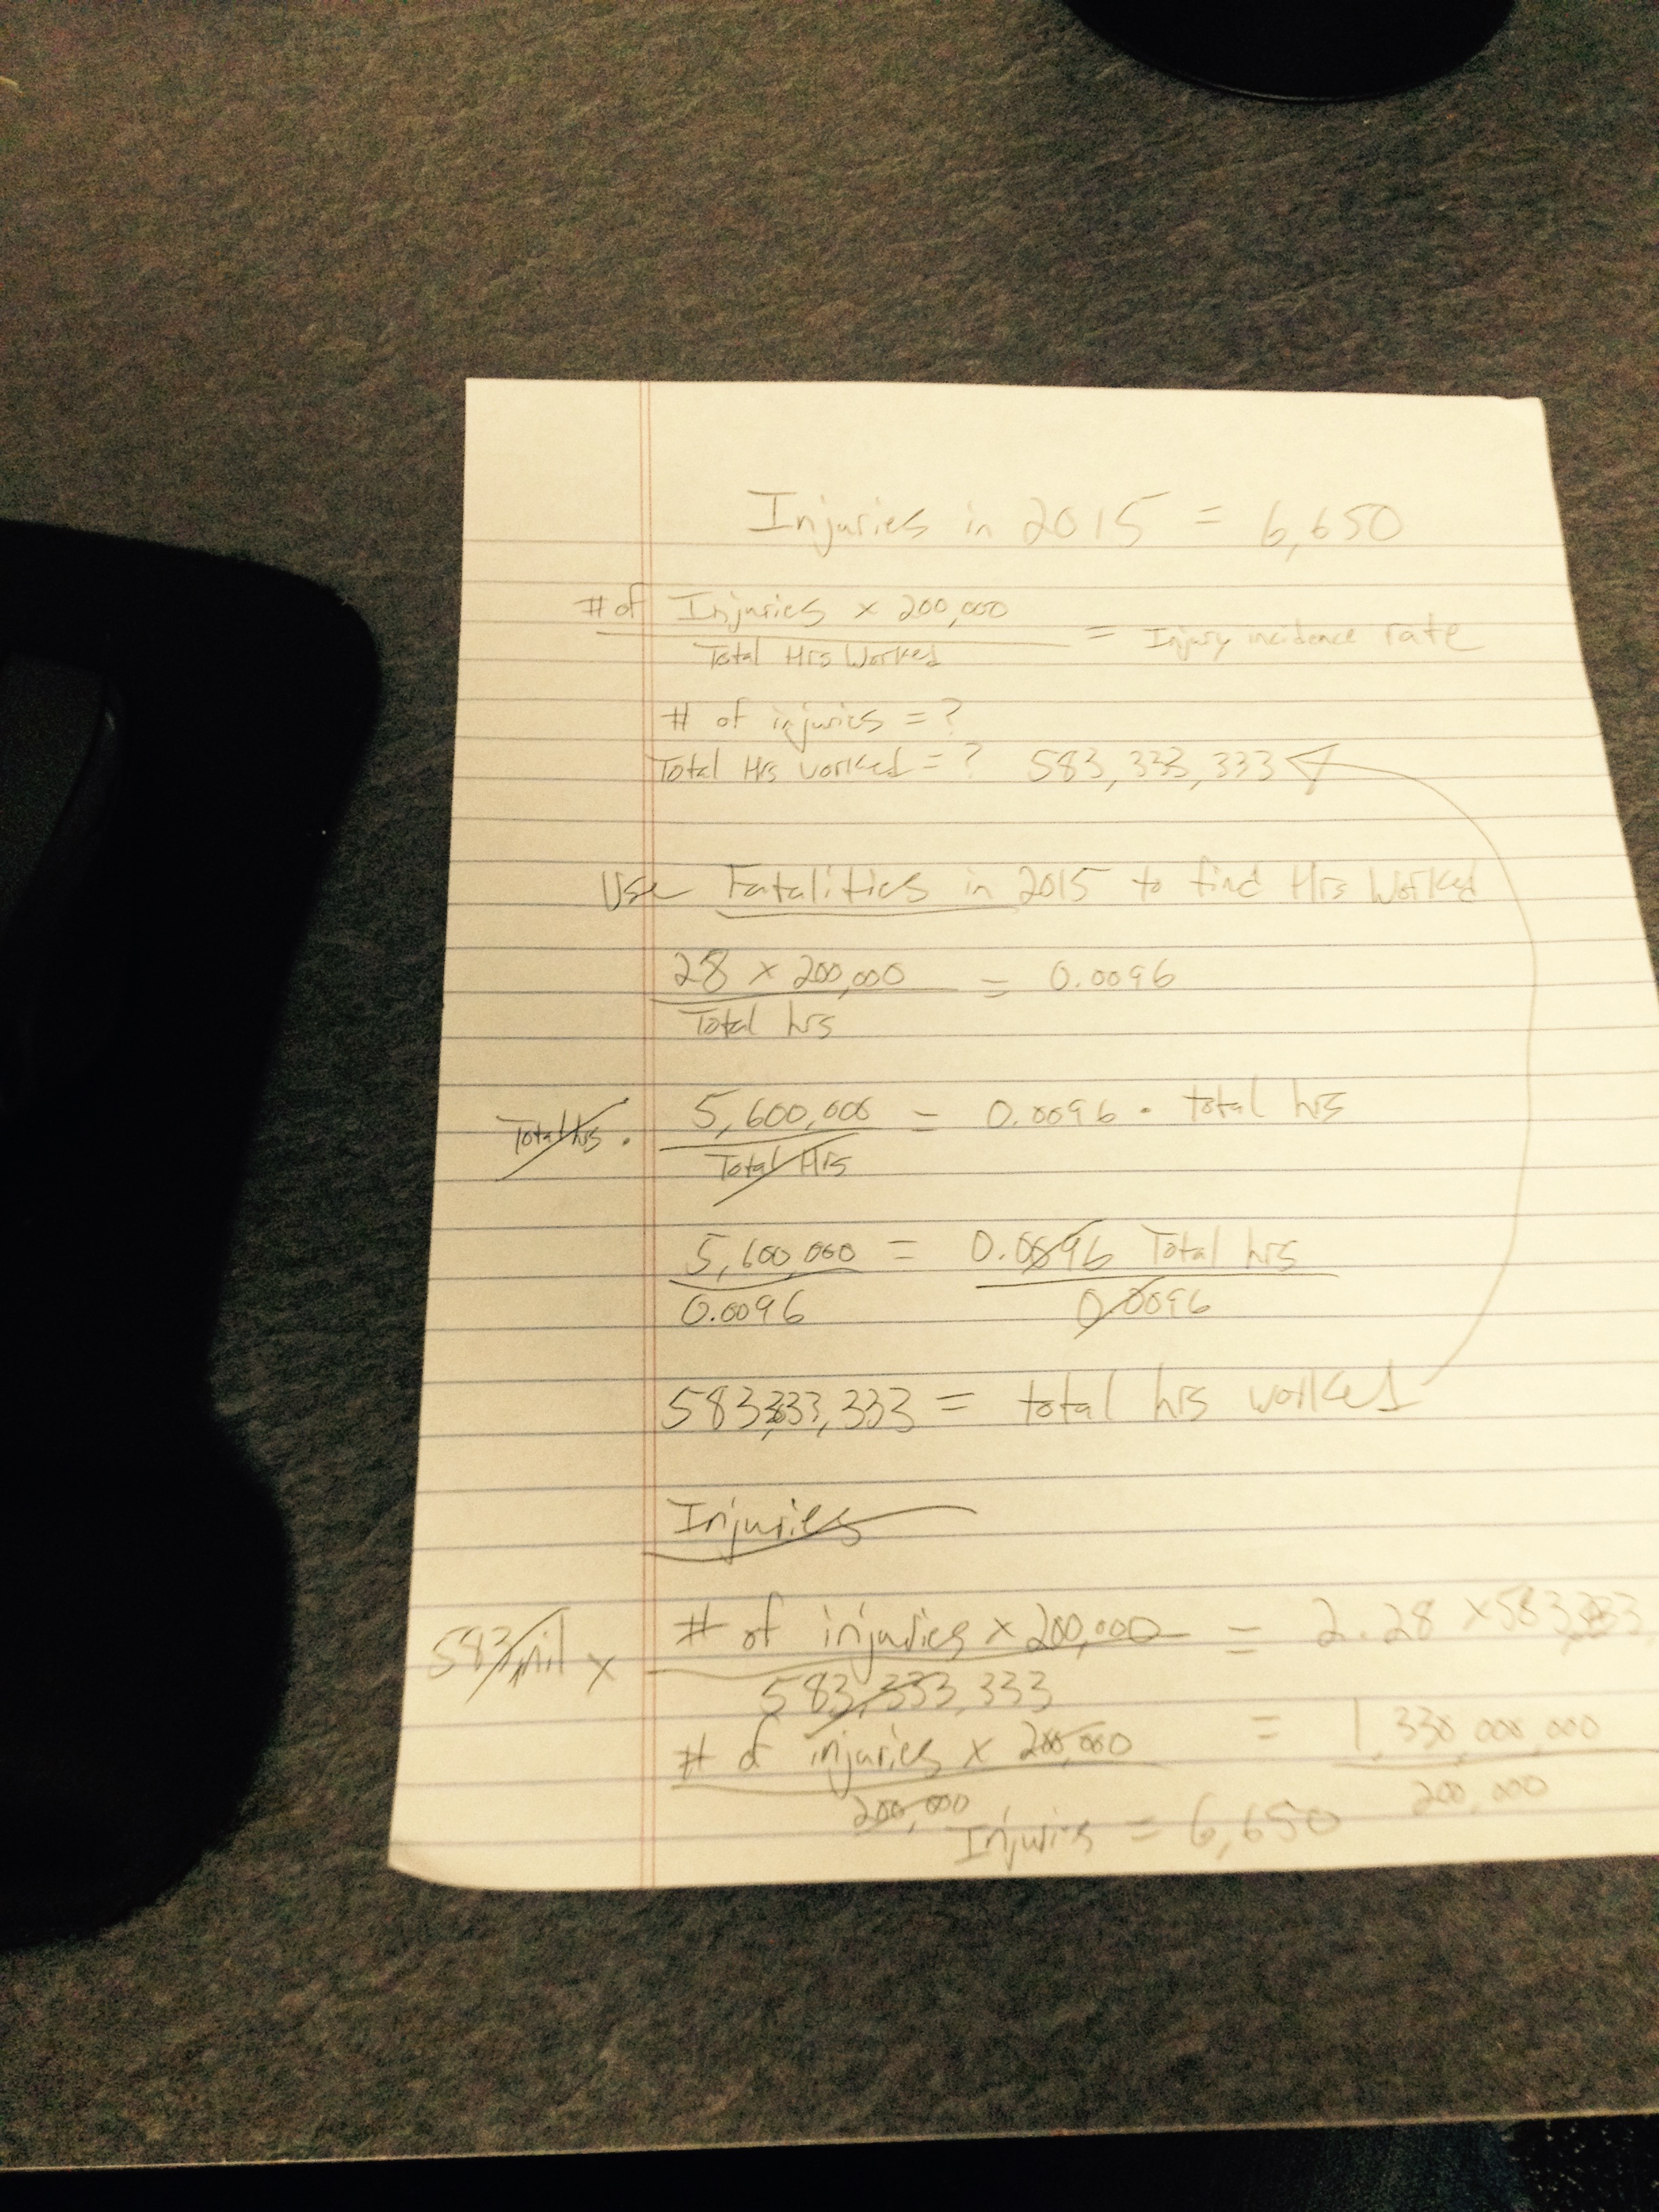
The mining industry combined for a total of 583.3 million man-hours in 2015. During that time, 6,650 total injuries occurred. Again, this number of injuries is a significant drop off. So while man-hours were down 7% from 2014 to 2015, the number of injuries dropped an impressive 13%.
![]()
Mining Industry Contractor Safety
Contractor fatalities were also down. In 2015, 8 contractors lost their lives compared to 12 in 2014. Obviously, a single loss of life is too many but a downward trend is great news. Unfortunately, MSHA doesn’t release the Total Injury Rate for Contractors.
The spike in overall fatalities and particularly contractors caused MSHA to declare a surge in the M/NM sector. These trends are promising but don’t look for MSHA to pull back their enforcement any time this year.
“The progress we made in 2015 is good news for miners and the mining industry. It is the result of intensive efforts by MSHA and its stakeholders that have led to mine site compliance improvements, a reduction of chronic violators, historic low levels of respirable coal dust and silica, and a record low number of mining deaths,” said Joe Main, assistant Secretary of Labor for Mine Safety and Health.
In other words, expect MSHA to continue their recent uptick in enforcement and inspections across the mining industry.
MSHA Fines Down
There is also another surprising piece of information in the article that could potentially be overlooked. The amount of MSHA fines is trending down. MSHA doesn’t count contested fines in these statistics which leads to artificially low numbers (MSHA reported $62.3 million collected for 2015, a giant drop from the $95 million average in 2013 and 2014.) So as cases wrap up, the total for 2015 will increase. But even if we throw out the artificially low 2015 numbers, the trend is still there. Even with this drop, MSHA inspectors still have a few tricks they like to try.
The most MSHA fines collected in a year occurred in 2010 with $162.8 million dollars. But since 2012, the trend has been decidedly downward.
![]()
This is good news for an industry that has had a very hard year. Safer mines and fewer fines? That’s something the mining industry and MSHA can both get behind.
Let’s work towards continuing both trends in 2016.